The House of Data Series: DataOps
This paper focuses on building, running, and monitoring data pipelines — including the collaboration model between teams, quality checks in flight, and what DataOps requires to support AI Trust. It does not cover data quality dimensions, governance policy, or architectural design decisions in depth — those are addressed in the Data Quality, Compliance, and Data Architecture whitepapers.
.png)
.png)
Get the Best of Data Leadership
Stay Informed
Get Data Insights Delivered
House of Data Series
Every strong data program is built like a house. Data Architecture forms the foundation — the platforms, pipelines, and operating model that everything else depends on. Seven domain pillars rise from that foundation, each one essential to a complete data program: Data Quality, Privacy, Data Security, DataOps, Compliance, Data Enablement, and Data Consumption. Data Literacy runs across all seven as a connecting beam, ensuring people at every level can read, interpret, and act on data. At the top, People & Leadership sets the direction, accountability, and culture that holds the whole structure together.
This series of whitepapers covers each component of the House of Data in depth. Each paper was written by Jim Barker (Principal, Data Strategy), with support from a practitioner with direct experience in that domain. Together, they form a practical guide to building data programs that earn — and keep — trust.
This paper covers DataOps — the engineering and operational discipline that builds and runs data pipelines, bridging ideation to business value across both Build and Run phases.
DataOps
DataOps is the fourth pillar of the House of Data — the engineering and operational discipline that builds and runs data pipelines. It bridges the ideation-to-business-value cycle, covering both the Build phase (designing and delivering new data capabilities) and the Run phase (operating them reliably at production scale). Where other pillars define policies and standards, DataOps is where they get implemented.
Introduction
Organizations with an aim to capitalize on data to grow their business and drive down costs are always taking a look out for capabilities with data. The core set of activities of rolling out and using new data capabilities is DataOps. The goal is to build solid processes on solid designs for the lowest possible cost of maintenance. This white paper delves into DataOps with a split focus of both Build and Run. Build is creating the new capabilities, and Run is the ongoing Operate of these processes.
As we move forward to discuss DataOps, remember the DataOps Manifesto: "Through firsthand experience working with data across organizations, tools, and industries, we have uncovered a better way to develop and deliver analytics that we call DataOps." Whether referred to as data science, data engineering, data management, big data, business intelligence, or the like, we have come to value analytics through our work. (DataOps Manifesto)
Atwal discusses a number of great development strategies in Practical DataOps. These include an agile framework and delivery, KPIs for data product feedback, the importance of building trust through the use of data lineage, and finally organizing different personas for developing new data capabilities FAST.
Schmidt in DataOps: The Authoritative Edition speaks of building data products using DataOps that are well designed, efficient, and both prepare data and address data quality needs. The goal, as Schmidt puts it, is to develop quickly and save time by avoiding the dreaded data integration 'hairball'.

The goal is to build out a model that has smart pipelines, that are built the right way, then use Data Observability to both capture situations where data is not delivered when it should, when record volumes are outside the norm, and stop processing when data quality thresholds are not met.
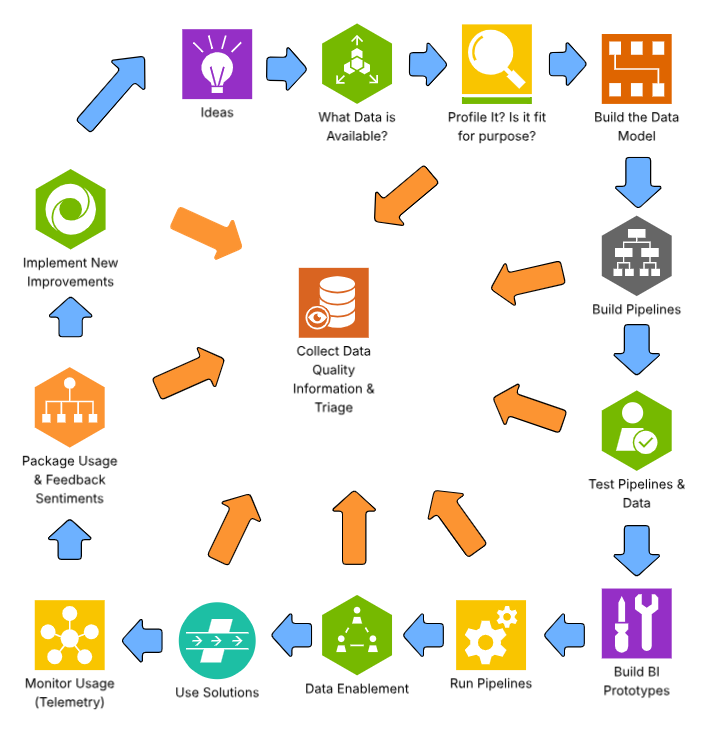
The manner to drive this out is depicted in the below diagram. It is a combination of: (1) data governance; (2) data competency; (3) planning and design; (4) strategic development and rollout. Further, it requires using a reference data architecture to build processes right the first time, leverage well-established testing strategies, and capture details throughout the development process. This approach not only accelerates development — it also simplifies the enablement process.

The next two sections will detail the build process, and introduce a run process for ongoing support for increased confidence by the business community and lower cost of maintenance for technical teams (TCM).
Build
Build will describe and detail the actions from ideation to delivering with a focus on business value. It is expected that data engineers will build processes based on configurable approaches — often with table-based reference data, data quality checks, well-tested transformation logic that will run with reduced compute resources but still run quickly and efficiently. These objectives are consistent regardless of streaming or more traditional batch processing. The goal of these processes is to develop them in a way that they have the lowest possible total cost of maintenance (TCM).
The build process overall will follow this methodology, the steps are: (1) Ideation; (2) Determine what data is available; (3) Data profiling; (4) Building data models; (5) Building data pipelines; (6) Testing data pipelines and resulting data; (6) Testing full process; (7) Building AI, BI, and Digital Transformation prototypes; (8) Production run pipelines — this feeds into data enablement and use of the new data capabilities.
These steps are detailed in this process flow, and following narrative.
Ideation
A key set of actions for driving out new capabilities is to listen to the business for ideas. This can be through strategic objectives, official requests, data governance surveys response, business challenges, or challenging market conditions. The recommended approach is to have mechanisms in place to ask for ideas of what is needed or wanted for business users. This ideation cycle should be "open" to all data consumers and never should a request be auto-deleted. Make a list to capture any and all requests. One way to do that is with a data governance inbox — a place to both get help, but always record ideas and collect appropriate detail.
Evaluate
Evolve these requests with appropriate level of pre-discovery and obtain approval and funding to move forward. If the requirements are declined or set to a background bucket, save the feedback for the requestor but save the details and evaluate work produced to use for future requests. Make sure to reach out to the submitter and thank them for their efforts, and assure them you will continue to keep a look out for similar requests to see if this need can be addressed in the future, or let them know the forecasted path to addressing this type of request. Use that submitter as someone to assist in design review, testing, and celebrate their contributions when their ask goes live. Reviewing the submitters' ideas with them, and thanking them for their enthusiasm will pay fast dividends in the long run.
Determine source data
In reviewing the request and starting design, discover the available data that "may" work for the request. This can come from data catalogs, past projects, data lineage, or very often the subject matter experts. Don't hesitate to use SMEs for help — a simple "where do I find this data" is often massively helpful and rarely causes negative feedback. People in the data space really do want to help.
Profile the data
Utilize profiling techniques to explore all the possible data sources. The outcome of a good profile typically includes:
- Column name
- Data type
- Inferred data type
- Min/max/key attributes
- String length
- Patterns
- Number of records
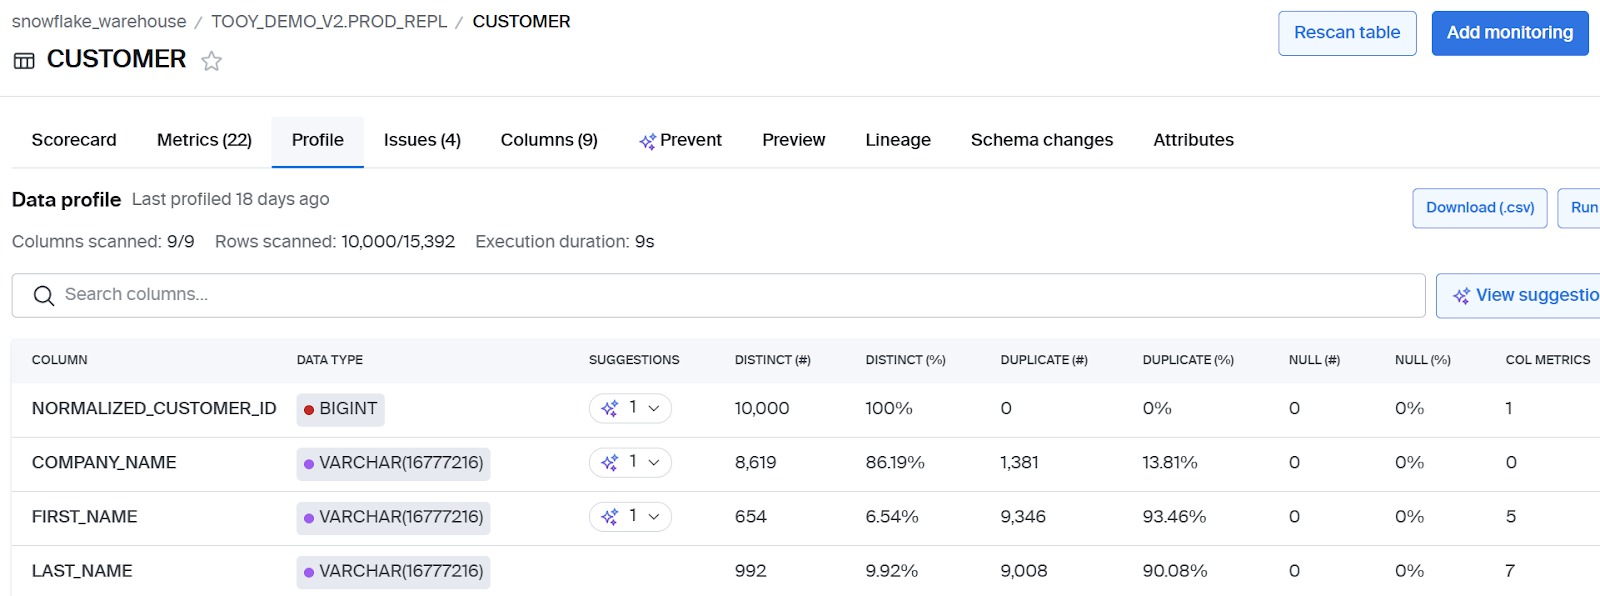
This can be used to both: (1) Determine the physical data model; (2) Detail data transformation or data quality rules, and business logic. While any engineer can write SQL statements very quickly, the profiling lets the engineer look at many data sets quickly and rapidly accelerate the development process.
Pipeline development
Once the target data model is established, business transformation rule requirements are known, and in-flight data checks for circuit breakers are designed, the data pipeline can be created. These pipelines should be developed, run, and tested. The team should then conclude with string testing, component testing, and system testing. The resulting target data should be profiled as part of that testing.
As these processes are developed, the detailed metadata should be collected and added to some sort of repository. A set of sample reports should be developed and run for validation and verification purposes. This metadata that is discovered by data engineers is extremely valuable. Data engineers tend to resist recording it, but doing so while developing is more efficient, more correct, and more reliable than trying to capture it in the days prior to enablement and roll-out.
Best practices for pipeline development include:
- Value value checks
- Range tests
- Reasonability tests
- Cross-reference transformation
- Well-formed numerical calculations
- Performance tuning of processes
The goal is to have well-formed code that is easy to maintain by any developer. This lowers the level of effort and cost for maintenance — that is, it lowers the total cost of maintenance.
Reference Data Architecture (RDA) is a best practice that builds out processes based on table-driven design. RDA is one way to build processes that are simpler to read and understand, and lower the level of effort to make any changes.
Business user involvement: It is easy for technical folks to stay engaged in building out their solutions and show the business users at completion. This pattern should be challenged to keep some business users involved throughout development. Business users who submitted the idea can be a great source of validation if provided the opportunity to share their experiences.
Create sample reports
It is expected that the developer will build out a set of sample reports as part of the build to complete validation and verification. This is also known as building BI prototypes, and has examples of the output that was envisioned for the solution. The goal of this set of "official sample reports" is to take this a step further. It is to build business-ready example reports that can be used for building job (training) aids, and showing business users in the rolling out of the new features. It is critical that these reports or dashboards demonstrate data correctness, clean formats, and show a high degree of ease of use.
Validation and verification
Validation is the set of steps that are executed to make sure each and every calculation is correct. It is the meticulous task that is complete for final evaluation.
Verification is the multi-cycle test that verifies process performance, or that the code runs correctly over many runs. It should also include testing and re-start processing.
Run
Run is the operating phase; it focuses on the continuous execution, integration, and business value derived. After these processes are developed, tested, and implemented, an operations mindset takes over. Any and all failures will be addressed within a service level agreement (SLA) and typically a rotating support model will be established. Good data engineering teams will establish a continuous improvement mindset, and routinely address any run issue prior to business awareness.
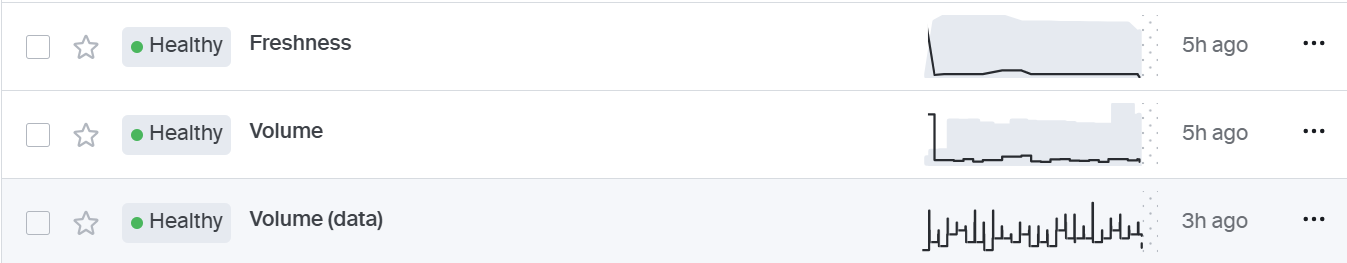
It is critical that there is consistent monitoring for pipeline reliability. This includes freshness of data: is data being refreshed on consistent time-scales, and volume: is the correct amount of data being provided in each run.
Once the data pipelines are developed, tested, and deployed, the focus needs to shift to the run phase of use or "Operate". During this phase there needs to be an operational process that covers five areas:
- Run and manage data pipelines
- Monitor the data quality
- Adapt the pipelines as needs arise
- Triage — i.e., fix data upon request from business, technical, and stewardship teams
- Oversee the data to ensure pipeline reliability and data quality
Run and manage data pipelines
Once the solution is built and tested, set up the data pipelines to run regularly. Set up pipeline reliability capabilities to alert the "Run" team when pipelines: (1) Are running late; (2) Running early; (3) Failing; (4) Processing too many records; (5) Processing too few records. These notifications along with process failure alerts ensure that the business is getting the data they have come to expect.
Data pipelines need to be scheduled and run reliably. When they fail, notifications will be sent out as they need to be run to completion on a regular time scale. Any delays need to be communicated, escalated, and managed.
Data observability software helps with this by providing pipeline reliability capabilities such as illustrating freshness and volume details, and providing the necessary alerts when something is off. All failures should be reviewed and improved to limit any bad results in business solutions. Business users typically are not very supportive of waiting for data to be available, as the efficient management of business processes is critical to the bottom line.
It is recommended to report out in a state-of-data report on pipeline effectiveness numbers to senior leadership each quarter.
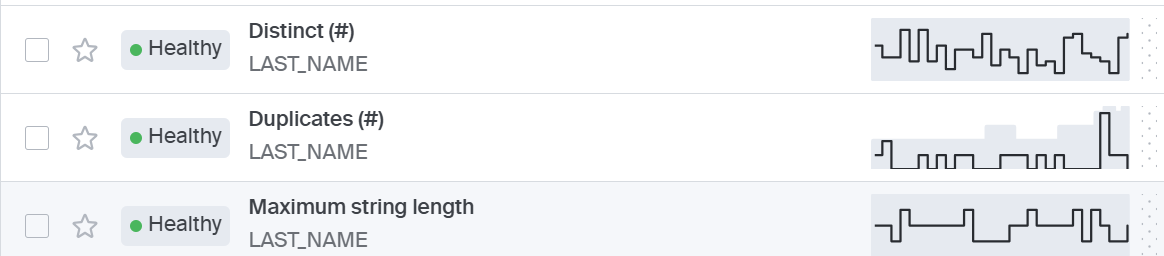
Monitor the data quality
Staff need to trust data. To achieve this, data quality checks are often implemented in-flight and at-rest. As the pipeline runs, any data quality checks that fail have the possibility to be suspended, to be triaged within operational parameters — often the next day or sooner. The stoppage of a pipeline due to data quality failures is referred to as circuit breakers.
At-rest data quality checks are a set of data quality checks that are run on a regular basis when the data has completed processing. Some of these checks will be daily/weekly/monthly. The goal of at-rest data quality checks is to find problems that may be caused by other data processes, by the shifting of time, or from other semi-related attributes changing in value.
In-flight data quality checks are a set of data quality checks that execute as data is processed. These capture data quality problems as data is flowing from one database to another, and will fire data quality circuit-breakers when too many failures occur. These in-flight checks can also be part of discard processing.
Circuit breakers are a step built into data pipelines that execute a data quality check, and when 1 or more than some threshold is hit, will stop the process, signal the DataOps team, and they will fix the process before reprocessing the data.
At-rest data quality checks and alerts should also be triaged and corrected. Many firms find the use of a RAIL (Ready Action Item List or "Risks" - "Activities" - "Issues" Listing) is helpful to capture needs and manage the completion of those activities and resolutions. With the RAIL, data teams can manage staff, re-prioritize needs, and have oversight into the addressing of the data pipeline and data quality issues.
Adapt the pipelines as needs arise
Data engineering teams collect feedback from the data processes, from business users, and from data stewards on areas that improvements could be implemented. Once these improvements are categorized, researched, and approved, a set of work efforts will be executed. This will follow the same process as new development utilizing profiling, development, testing, and documentation. A couple of Six Sigma tools can be used to better understand where these problems exist.
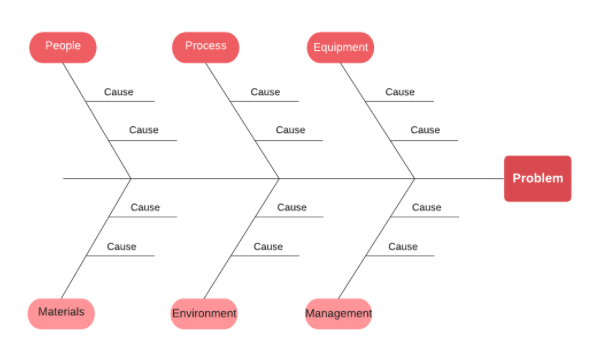
Cause and effect diagrams
One example of this is cause-and-effect diagrams (Ishikawa Diagram), or a fishbone chart. The idea of a fishbone diagram is to have the problem in the far right, having branches or categories of the main causes of the issue off the sides of a line, and examples of each off of each branch.
PDCA diagram
Another Six Sigma tool that provides even greater benefits in this area is a PDCA (Plan-Do-Check-Act) Diagram, or the Shewhart Circle. This is the idea that once problems are identified, the following steps will be taken to improve the situation: (1) Plan; (2) Do; (3) Check; (4) Act.
- Plan — The idea of continuous improvement when the engineering team reviews the process and determines what improvements to make.
- Do — Make the necessary changes, test the improvement, deploy to production, and reap the benefits.
- Check — After the change is implemented, evaluate its benefits and document any concerns.
- Act — Take away any additional change needed based on the results of the check.

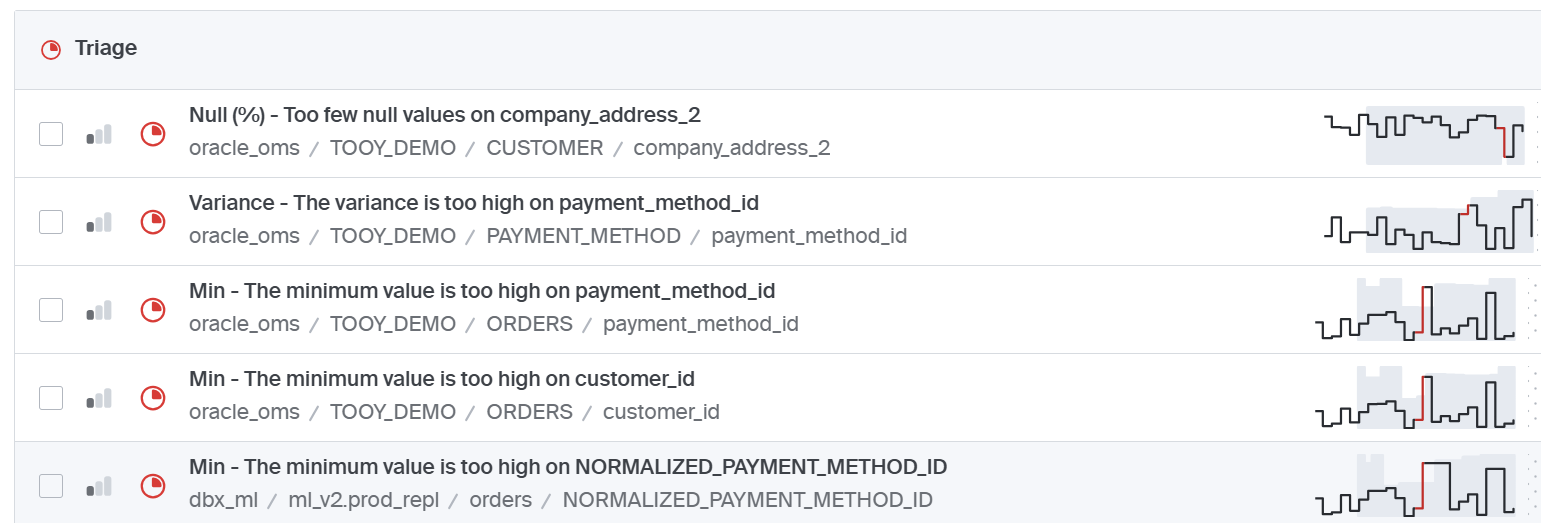
Triage
Whenever an assigned engineer finds a problem and changes code through a maintenance lifecycle so that it can prevent a problem — that is ideal. There are many instances where it is determined the implementation of a pipeline change isn't the right answer. In those cases, data triage requests are sent to the data steward to take action. The data steward will research the problem and make the necessary changes in the organization system, or enlist the functional teams for support. The functional teams will often make the changes and close out a ticket.
This management of triage requests or issues is critical. It is vital to have and manage a place to track this. Some shops will use a process like the RAIL to collect the need, manage it, and potentially build out an aging report to find the older requests and action these or simply re-prioritize.
Oversight
The last major run area of DataOps is regular checks of pipeline reliability and at-rest data quality. The idea is that by looking across time for any variation of run details, you can find that data pipeline or data quality reviews provide a timely review of changes that may be more difficult to notice at any single point in time.
By looking across time, data teams find errors only exposed by reviewing trends. Additionally, the DataOps team should review dashboards and drill into reports to find areas of concern, analyze the trends, and take action.
Run summary
It is critical that data engineering and data stewards work well together with cooperativeness across the five areas: (1) Run and Manage Data Pipelines; (2) Monitor the Data Quality; (3) Adapt the pipelines as needs arise; (4) Triage — i.e., fix data upon request from business, technical, and stewardship teams; (5) Oversee the data to ensure pipeline reliability and data quality. This collaboration and cooperation is the difference between a solid data program and dysfunction and frustration.
AI trust relationships with DataOps
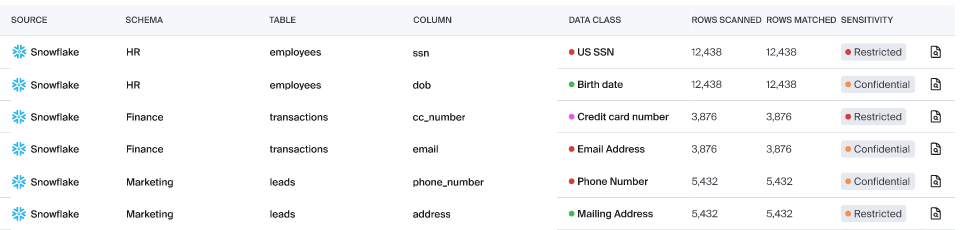
Establishing consistent DataOps as the building and running of data-related processes — in today's climate of AI/ML, DLP, and GenAI — needs to be part of that landscape. This means that the development of new AI capabilities must include taking into account the goals and needs of: (1) Data Security; (2) Data Privacy; (3) Data Quality; (4) Policies and Enforcement.
The outcome of DataOps is solid data. Many businesses will build out data for AI and partition it in a place reserved for AI processes, or more specifically put only allow AI to pull from that location. These systems must be developed in a way to restrict sensitive data, and prevent AI applications from using data that is restricted from AI use by AI Solutions.
Remember: Good AI answers start with trusted data.
Bigeye's role in DataOps
Bigeye has a large role to play in DataOps. Its features are in-line with the process to run efficiently and increase the confidence of your user community. Its functionality includes:
Summary
DataOps is the set of activities more tightly aligned to data engineers. It is the building and running of data pipelines. Data pipelines are how data gets from originating source systems into the analytics data platforms. This white paper also shared the role of DataOps in AI Trust, how some continuous improvement tools can provide benefit, and a framework for building capabilities for a highly efficient back-end for all data processing.
References
- Atwal, H. (2020). Practical DataOps: Delivering Agile Data Science at Scale (1st ed.). Apress.
- Schmidt, J., & Basu, K. DataOps: The Authoritative Edition.
- DataOps Manifesto. https://dataopsmanifesto.org
- Ishikawa, K. (1976). Guide to Quality Control (2nd ed.). Asian Productivity Organization.
- Shewhart, W. A. (1939). Statistical Method from the Viewpoint of Quality Control. The Graduate School, Department of Agriculture, Washington.
- Deming, W. E. (1986). Out of the Crisis. MIT Center for Advanced Engineering Study.
Monitoring
Schema change detection
Lineage monitoring
Jim Barker

.png)
.png)

.png)