The House of Data Series: Data Consumption
This paper focuses on consumption patterns, consumer behavior, and the feedback loops between data teams and business users. It does not cover pipeline architecture, quality monitoring tooling, or data governance frameworks in depth — those are addressed in the DataOps, Data Quality, and Compliance whitepapers.
.png)

Get the Best of Data Leadership
Stay Informed
Get Data Insights Delivered
House of Data Series
Every strong data program is built like a house. Data Architecture forms the foundation — the platforms, pipelines, and operating model that everything else depends on. Seven domain pillars rise from that foundation, each one essential to a complete data program: Data Quality, Privacy, Data Security, DataOps, Compliance, Data Enablement, and Data Consumption. Data Literacy runs across all seven as a connecting beam, ensuring people at every level can read, interpret, and act on data. At the top, People & Leadership sets the direction, accountability, and culture that holds the whole structure together.
This series of whitepapers covers each component of the House of Data in depth. Each paper was written by Jim Barker (Principal, Data Strategy), with support from a practitioner with direct experience in that domain. Together, they form a practical guide to building data programs that earn — and keep — trust.
This paper covers Data Consumption — the seventh pillar of the House of Data, and the reason all the other work gets done. Every pipeline built, every quality check configured, every governance policy written exists in service of this: getting trusted data into the hands of people and systems that use it to make decisions. This paper covers the five forms data consumption takes, how consumers can engage more effectively with the capabilities available to them, and how to bring research-level critical thinking to the data you rely on every day.
Data Consumption
There is a large amount of work that goes into making data available and trusted. Pipelines are built, schemas are governed, quality checks are configured, access controls are enforced, and documentation is written. All of it exists for one reason: consumption. Someone needs to use the data to do something — make a decision, automate a process, respond to a condition, or answer a question.
That sounds obvious, but in practice many data programs lose sight of it. Teams optimize for pipeline reliability, for coverage of monitoring rules, for completeness of the data catalog. Those are all valuable. They're also means, not ends. The measure of a data program is whether the people and systems consuming its outputs are making better decisions than they would without it.
This paper is a reminder of what the outcome of all that work looks like — the capabilities that should be available to consumers, the ways consumers can engage with those capabilities more effectively, and the critical thinking skills that separate data-literate users from people who treat whatever the dashboard shows as automatically correct.
Capabilities
Data programs produce outputs in five distinct forms. Building capabilities across all five is strongly recommended — each serves a different audience, a different decision-making speed, and a different level of analytical depth.
Data programs produce outputs in five distinct forms. The table below describes each consumption type, its trade-offs, and the primary business value it delivers. Building capabilities across all five is recommended — each serves a different audience and decision-making speed.
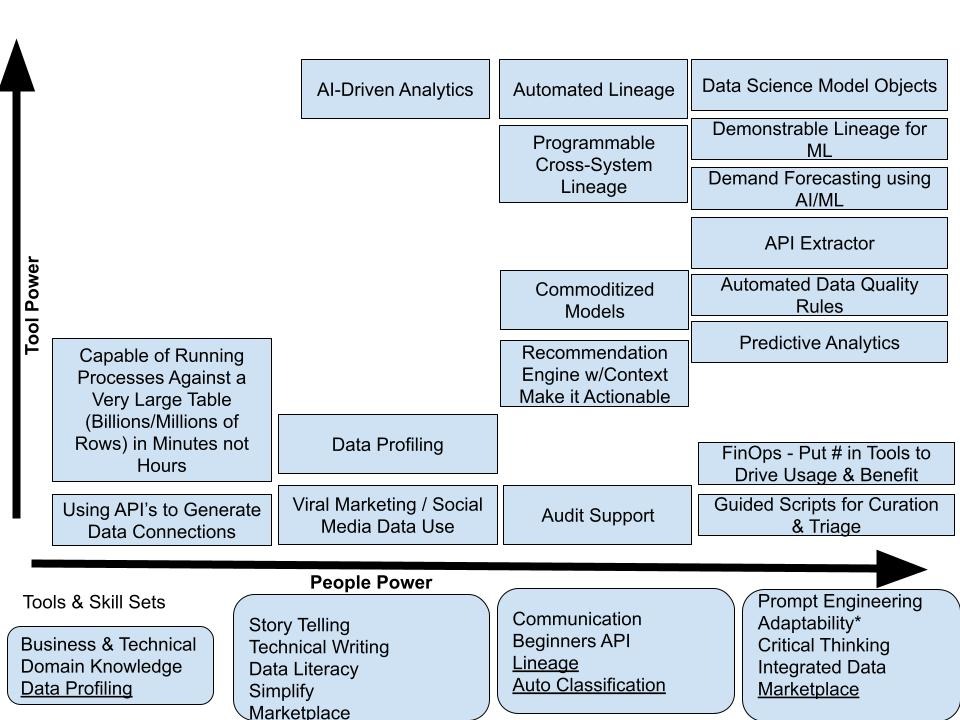
Consumers should understand and leverage these capabilities, but it isn’t enough to simply use them. How they are used for understanding and actively engaging with your business is more important. The following is a chart that illustrates how increases in software capabilities along the X axis aligned with growth of the intellect of your staff will grow out stronger and stronger uses of your data.
Think of this, as your staff gets smarter, increases their data literacy, and sees how topics such as AI provide benefit match up with the improvement in technology what kind of things can you accomplish:
Assistance
Consumption will be providing new capabilities as those are rolled out; they should be provided a set of job aids, training materials, and recordings to help the user be successful. The consumers of these capabilities need to take advantage of them. Time is invested in the building of these to help people be successful, not simply to check the box that has created something to make the project management office happy.
As teams are successful with new capabilities, data governance teams should survey the consumers to help understand what is working, what is not, and what to do differently next time.
Ask #2: As a consumer - Complete any survey sent to you by the data governance team.
As you begin to use these capabilities, leverage the assets, be open to share your experiences, but don’t be afraid to ask for help.
Ask #3: When you are stuck, ask for help!!!
Ideation: closing the feedback loop
Data leaders don't know everything the business needs. That isn't a failure of the data program — it's a structural reality. The people closest to the data, using it to do their jobs every day, have a clearer view of what's missing, what's confusing, and what would actually make a difference than any central team can develop from the outside.
Ideation is the set of channels through which consumers can surface that knowledge. Five tools are described here, each suited to a different kind of input and a different kind of user.
Data teams don't have full visibility into what consumers actually need. These five ideation channels give consumers a structured way to surface ideas, flag problems, and shape the direction of new capabilities — making the feedback loop between users and data governance teams explicit.
Great ideas come from people who use the data. The channels above exist to capture those ideas systematically — but they only work if consumers actually use them. Providing ideas for new capabilities isn't an optional contribution. It's part of what makes a data program better over time.
Coaching: sharing what you know
Every data program has people who've figured things out — who know which reports to trust, how to get help when they're stuck, which data steward to call about which dataset. Those people are data coaches, whether or not they have a formal title.
Effective data programs make coaching explicit. They identify who the coaches are, make that visible to others, and create space for knowledge sharing rather than leaving it to happen by accident. When someone gets stuck, they should know who to ask. And when someone figures out something useful, the expectation should be that they share it rather than keeping it as a personal advantage.
Sharing how you use data capabilities helps your entire organization. Participating in the community of practice, writing up what works, being available when a colleague is stuck — this is how institutional knowledge compounds rather than walks out the door when individuals change roles.
Critical thinking: four research concepts for everyday data use
One of the persistent problems in data consumption is autopilot. A report is generated, a system provides it, and it's treated as correct because the system produced it. This problem is more pronounced with AI, where the confidence of the output can mask the uncertainty of the underlying data. People trust the number because a machine provided it, and machines seem authoritative.
There's a useful corrective from the field of scholarly research. Four concepts — validity, reliability, dependability, and bias — are standard tools in academic research methodology. They translate directly to how practitioners should approach any data output they're about to act on.
Not all reported data is equally trustworthy. These four concepts, drawn from research methodology, give consumers a framework for critically evaluating any report, dashboard, or AI output before acting on it.
These aren't academic abstractions. Every analyst who has re-run a query until it produced an expected answer has encountered the bias problem. Every team that has reported on a metric without understanding what it was actually capturing has encountered the validity problem. Bringing these concepts explicitly into how consumers approach data outputs raises the standard for what counts as a sound basis for a business decision.
Voice of the customer and continuous improvement
Consumption isn't a one-way channel where data teams push outputs and business users accept them. The most effective data programs treat consumption as a continuous feedback loop — and Voice of the Customer (VOC) is one of the most practical tools for running that loop well.
VOC is a structured process from Six Sigma for collecting unfiltered input from the people using your product or service. In data program terms, that means collecting feedback from the people using reports, dashboards, and AI outputs — without leading the witness. VOC exercises that start with a biased question produce biased results. The goal is to hear what users actually experience, not to confirm what the team thinks is working.
Done right, VOC increases user satisfaction, improves analytical outcomes, and demonstrates that the data program is responsive to the people it serves. It can be as simple as a structured conversation or as involved as an observed "chairside" session — watching a user interact with an analytical product and recording what they do and where they struggle, without intervening.
Six Sigma: 5 s’s
Data professionals who handle large volumes of ad hoc requests, manage their own analytical environments, or run recurring reporting processes often struggle with organization and efficiency. The 5 S's — a lean manufacturing framework adapted for knowledge work — offer a practical structure for improving output without increasing effort.
Sort means eliminating what isn't needed: outdated reports, unused data sources, redundant queries. Straighten means organizing what remains so the right thing is easy to find. Shine means regularly reviewing and cleaning up the work environment — stale queries, broken connections, undocumented files. Standardize means building systems and procedures so the first three steps happen consistently rather than in a crisis. Sustain means maintaining that standard through continuous improvement rather than letting entropy win over time.
Teams that apply this framework to their data work typically find that a significant portion of their time is being spent on work that could be eliminated, consolidated, or made faster with minimal effort. The payoff isn't just efficiency — it's cleaner outputs and less time explaining why something is inconsistent with something else.
AI trust and data consumption
The most significant shift in data consumption in recent years is the arrival of AI as a primary consumer and a primary output channel. AI systems both consume data (training sets, live inference feeds) and produce data outputs (predictions, generated content, recommendations). Both directions introduce trust considerations that weren't present in traditional reporting environments.
On the consumption side, AI capabilities complete business processes faster and surface insights that manual analysis would miss. But they don't eliminate the need for human judgment — they change its form. Autonomous processes almost always have a level of review and approval built in, and those review steps only work if the humans involved are meaningfully engaged, not just rubber-stamping outputs.
Achieving AI Trust in consumption requires building control loops into AI-powered processes: mechanisms that allow people to raise alerts, flag concerns, or take corrective action when something looks wrong. "Human-involved" and "human-participating" aren't the same as "human-approved after a 10-second glance." The standard is active engagement from people who understand what the process is doing and are positioned to catch failures when they occur.
Bigeye’s role in consumption
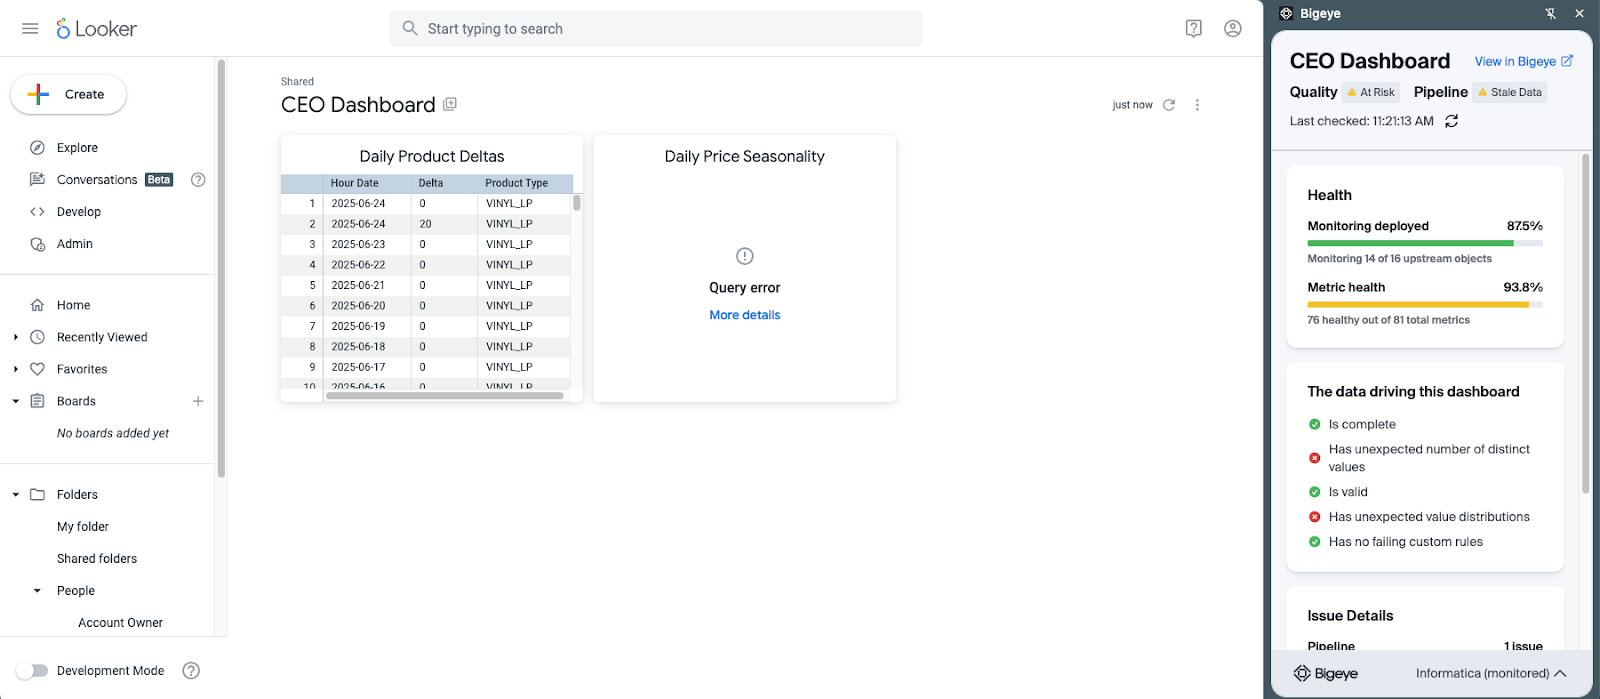
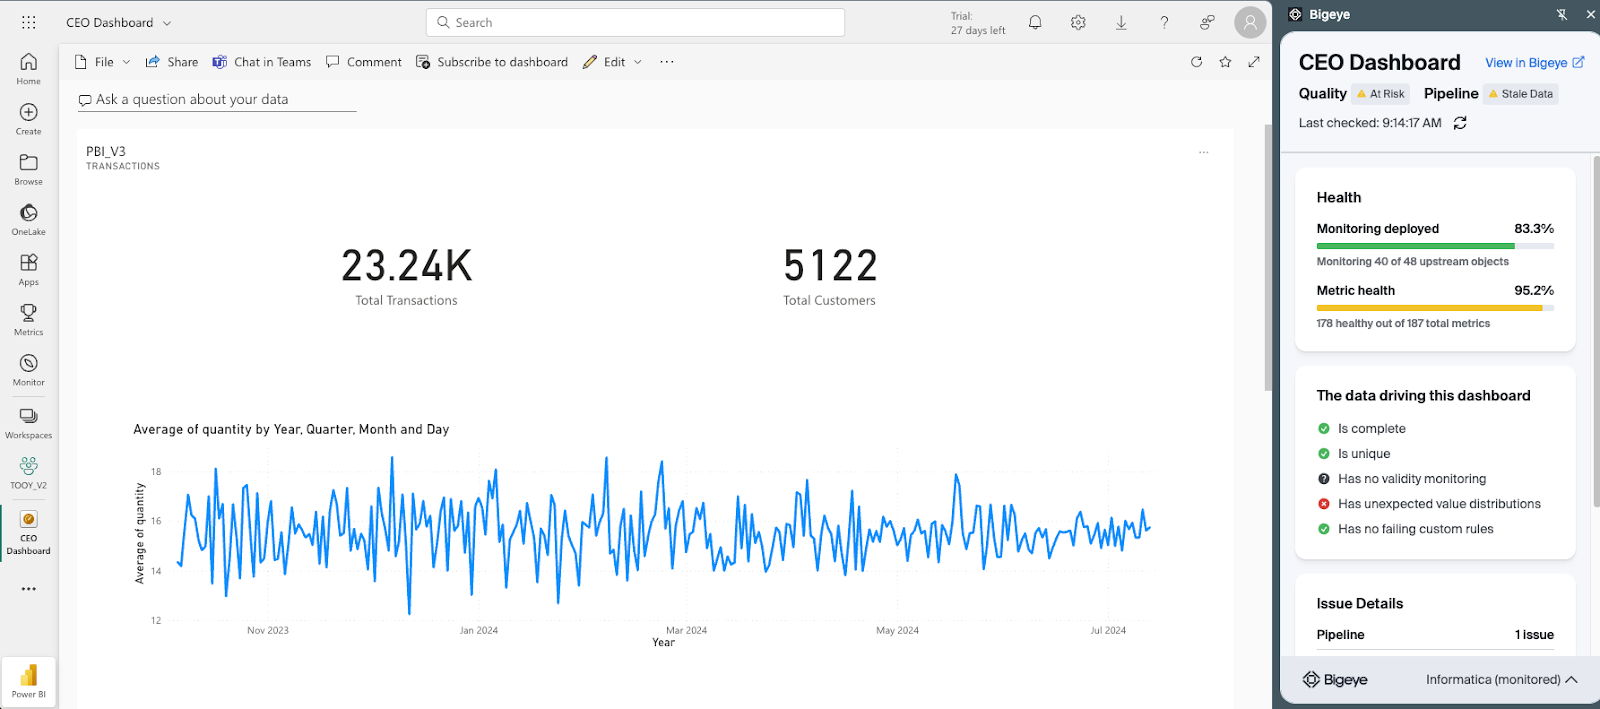
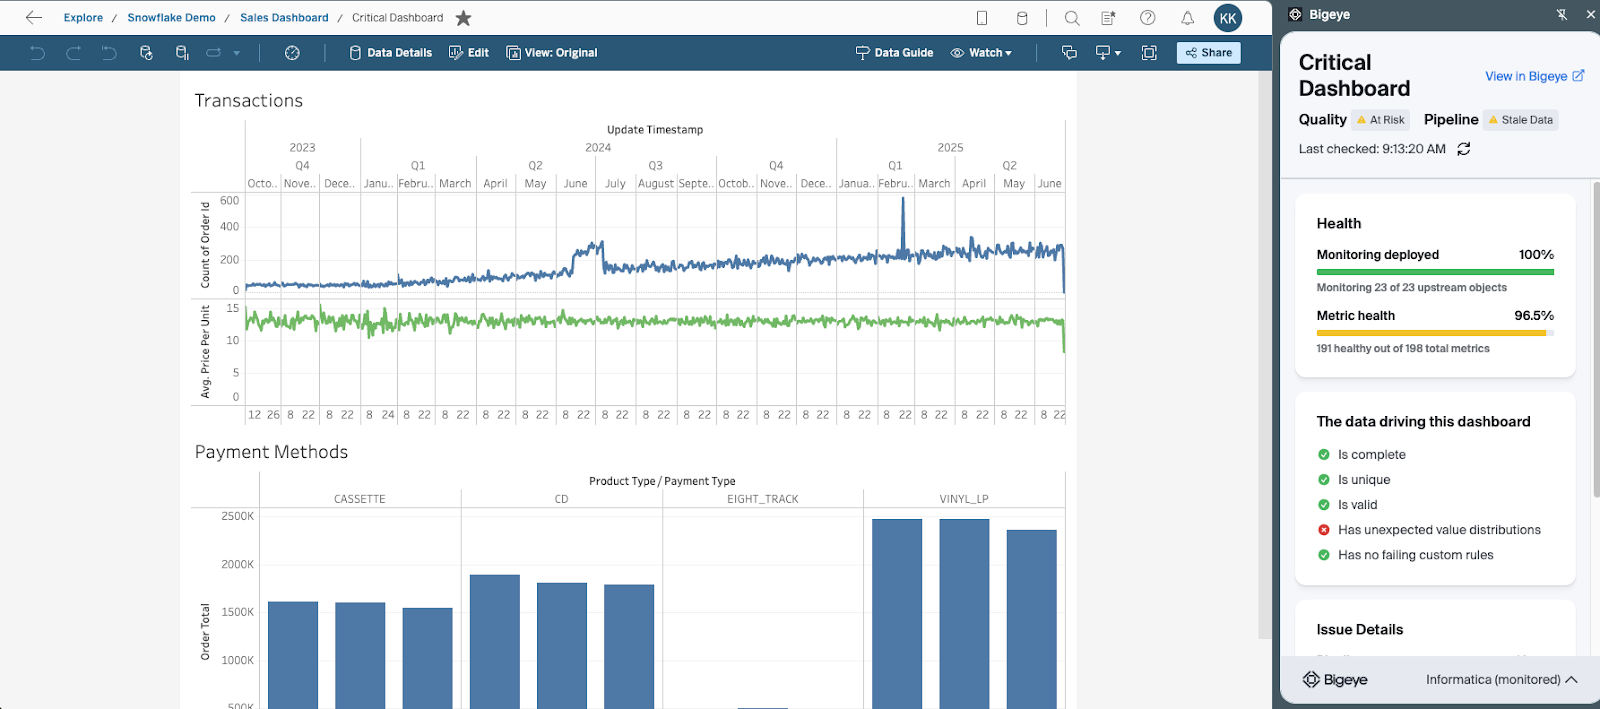
Bigeye supports data consumption in three ways — two of which are invisible to the end user by design, and one that surfaces directly inside the tools they already use.
Bigeye browser extension showing data quality health indicators within Looker, PowerBI, and Tableau.
Looker
PowerBI
Tableau
Summary
Consumption is what data programs are built for. All the architecture, quality monitoring, governance, and security work exists so that the people and systems who need data can get it, trust it, and use it to make better decisions.
That outcome doesn't happen automatically. It requires consumers who actively engage with the capabilities available to them, who provide feedback so teams know what's working, who share their knowledge with others, and who bring critical thinking to what they're looking at rather than treating the output of any system as automatically correct.
It also requires data programs that close the loop — building feedback channels, training users, making data quality visible at the point of consumption, and continuously improving based on what they hear. The five consumption capabilities, the ideation tools, the research concepts, and the quality visibility provided by tooling like Bigeye all point toward the same goal: data that gets used, and used well.
References
Roberts, Paula, and Helena Priest. "Reliability and validity in research." Nursing Standard, vol. 20, no. 44, 12 July 2006, pp. 41+. Gale OneFile: Health and Medicine. Accessed 16 Nov. 2025.
Avizienis, A., Laprie, J. C., & Randell, B. (2001). Fundamental concepts of dependability. Technical Report Series-University of Newcastle upon Tyne Computing Science.
Dubrova, E. (2013). Fundamentals of dependability. In Fault-tolerant design (pp. 5-20). New York, NY: Springer New York.
Voice of the Customer in Six Sigma (2025).
Chakravorty, S. S., & Shah, A. D. (2012). Lean Six Sigma (LSS): an implementation experience. European Journal of Industrial Engineering, 6(1), 118-137.
Wedgwood, I. D. (2006). Lean sigma: A practitioner's guide. Prentice Hall PTR.
Monitoring
Schema change detection
Lineage monitoring
What are the five types of data consumption, and how do I know which one to build?
The five are AI, alerts, dashboards, digital transformation, and reports. They're not mutually exclusive — a mature data program should have capabilities across all five. The right starting point depends on your audience and the decision speed you're optimizing for. Executives need dashboards. Operations teams need alerts. Analysts need reports. AI is most valuable once the underlying data is trusted enough to train on.
What's the difference between a data coach and a data steward?
A data steward owns the quality and governance of a specific dataset — they're accountable for what the data contains, what it means, and whether it meets quality standards. A data coach is more about capability transfer: they're the person in your team or org who knows how to use data tools effectively, how to get help, and how to make sense of outputs. Stewards own the data. Coaches help people use it.
How should data governance teams handle feedback from consumers?
Through consistent, structured channels rather than ad hoc requests. The ideation tools in this paper — a governance inbox, surveys, community of practice sessions, facilitated focus groups — exist to make feedback collection systematic. One-off feedback gets lost. Feedback collected through repeatable channels gets prioritized, tracked, and acted on. Consumers who see their input reflected in new capabilities are also more likely to keep providing it.
Jim Barker

.png)
.png)

.png)