.webp)
Get the Best of Data Leadership
Stay Informed
Get Data Insights Delivered
As data pipelines grow more complex, monitoring becomes more important to achieving reliable data. But a question many data reliability engineering practitioners will face is how to roll out monitoring. Should you start close to the source and work up the pipeline? Or begin close to the destination and work down the pipeline?
Much depends on your setup and goals, but there are generally two schools of thought. The first is that you should monitor close to the origin of the data, so that you can identify the problem as early as possible. This might mean monitoring your production OLTP database, or at a minimum, the raw replication of the production database once it lands in the warehouse.
The second is that you should monitor as close to the end of the data pipeline as possible, meaning the final set of input tables for a given application, like a dashboard or an ML model. By this point, it’s too late to do anything if you catch a problem, but on the other hand, any issues with any previous step in the pipeline would be captured. There’s nothing left in the pipeline that can go wrong.
A good analogy for this might be unit testing vs. end-to-end testing. Unit tests provide functional verification, while end-to-end tests check the entire behavioral flow of the system. Ideally you should have both, but if your company is just starting out with data observability, our recommendation is that you begin with monitoring close to the destination, and then work your way backwards over time. The point of monitoring is to prevent problems from reaching stakeholders. False-negatives in that context can be costly.
Monitoring close to the source
Monitoring close to the source can mean a variety of options depending on your setup and how far up the pipeline you would like to go.
For instance, you might have a microservice that handles user signups that’s backed by Postgres.
Application Database → ELT → Data Warehouse (TL)
The data in Postgres might then get replicated into Snowflake, then transformed several times before being fed into queries that drive a dashboard.
In this scenario, you have a couple options. You can:
1. Monitor the application database directly
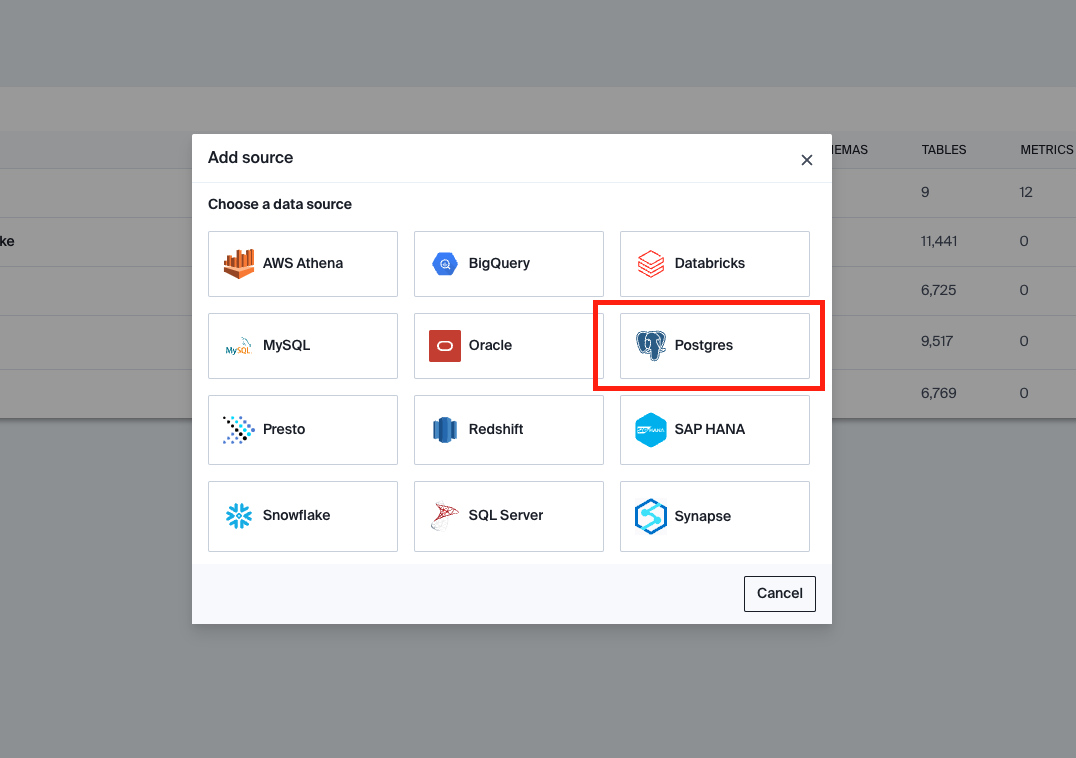
Bigeye can monitor Postgres and MySQL tables directly.
2. Add monitoring within the replication tool (though off the shelf options here are currently quite limited).
3. Monitor as it lands as a raw table in the warehouse
In more modern “ELT” setups, it’s common that most of the transformations will happen inside the data warehouse, and data is straightforwardly snapshotted from the application database to the data warehouse.
In this scenario, you can also choose to monitor the raw tables as they land in the data warehouse. Since this data has not been transformed, the most important and effective metric might just be a freshness metric – i.e. whether the data is showing up in Snowflake at all.
4. Monitor a delta between application db and data warehouse
The last thing you can do is to use Bigeye Deltas to create a Delta between the application DB and the snapshotted raw table in the data warehouse. Deltas track two tables and checks that the two are the same. This ensures that nothing in the “load” step of the data pipeline has gone wrong.
An alternative scenario to the above application db might be a streaming dataset - for instance, if you have data logged by a phone that’s being pushed into a Kafka topic. You might want to monitor the data before it lands in the warehouse, or there may not be a final warehouse destination at all.
Phone/Logs → Kafka → Data Lake / Direct consumer applications
In this scenario, you may want to monitor the data while it’s in flight within a Kafka topic, rather than waiting for it to land in the data lake. Tools like Rockset and Materialize are extremely helpful here because they materialize views on top of streaming data, making it possible for monitoring tools like Bigeye to collect statistics from the streaming data using SQL.
Once your streaming data is being ingested into Rockset, Bigeye is able to monitor the resulting Rockset collections directly, giving you near-real time statistics about your streamed data.
Monitoring close to the destination
Our recommendation at Bigeye is for companies to monitor close to the destination. For most clients, this means the final, transformed tables in the data warehouse. These tables are likely to drive business and product decisions and power important dashboards that are frequently reviewed. Problems in these tables, then, will have a high impact; monitoring them should be considered high priority.
The nice thing about ELT and running transformations inside the data warehouse is that there are now a variety of ways to monitor the earlier steps in the data pipeline, without having to do too much extra work. If you have more questions about where to monitor for your setup, please reach out to us.
Monitoring
Schema change detection
Lineage monitoring

Kyle Kirwan


.webp)

.webp)