.webp)
Get the Best of Data Leadership
Stay Informed
Get Data Insights Delivered
So you’ve found a data issue with Bigeye, now what? In this two-part blog we’ll walk through several scenarios and share tips and tricks for handling uncovered data issues in Bigeye.
In part one, we’ll start with the simplest and fastest ways to triage a single issue. Then we'll work our way up to handling dozens or even hundreds of data issues in minutes in part two.
Let’s start by setting up our scenario:
The team
Frank is the typical data engineer who is on-call for handling operational data pipeline reliability and is a user of Bigeye. He’s part of a small team responsible for the overall health of the data and data pipeline.
Becky is a data engineer who builds and maintains new data pipelines—focusing on the transformations and combinations of data from different sources. She cares about pipeline reliability, but is more focused on making sure the data is high quality and data values seem reasonable.
The environment
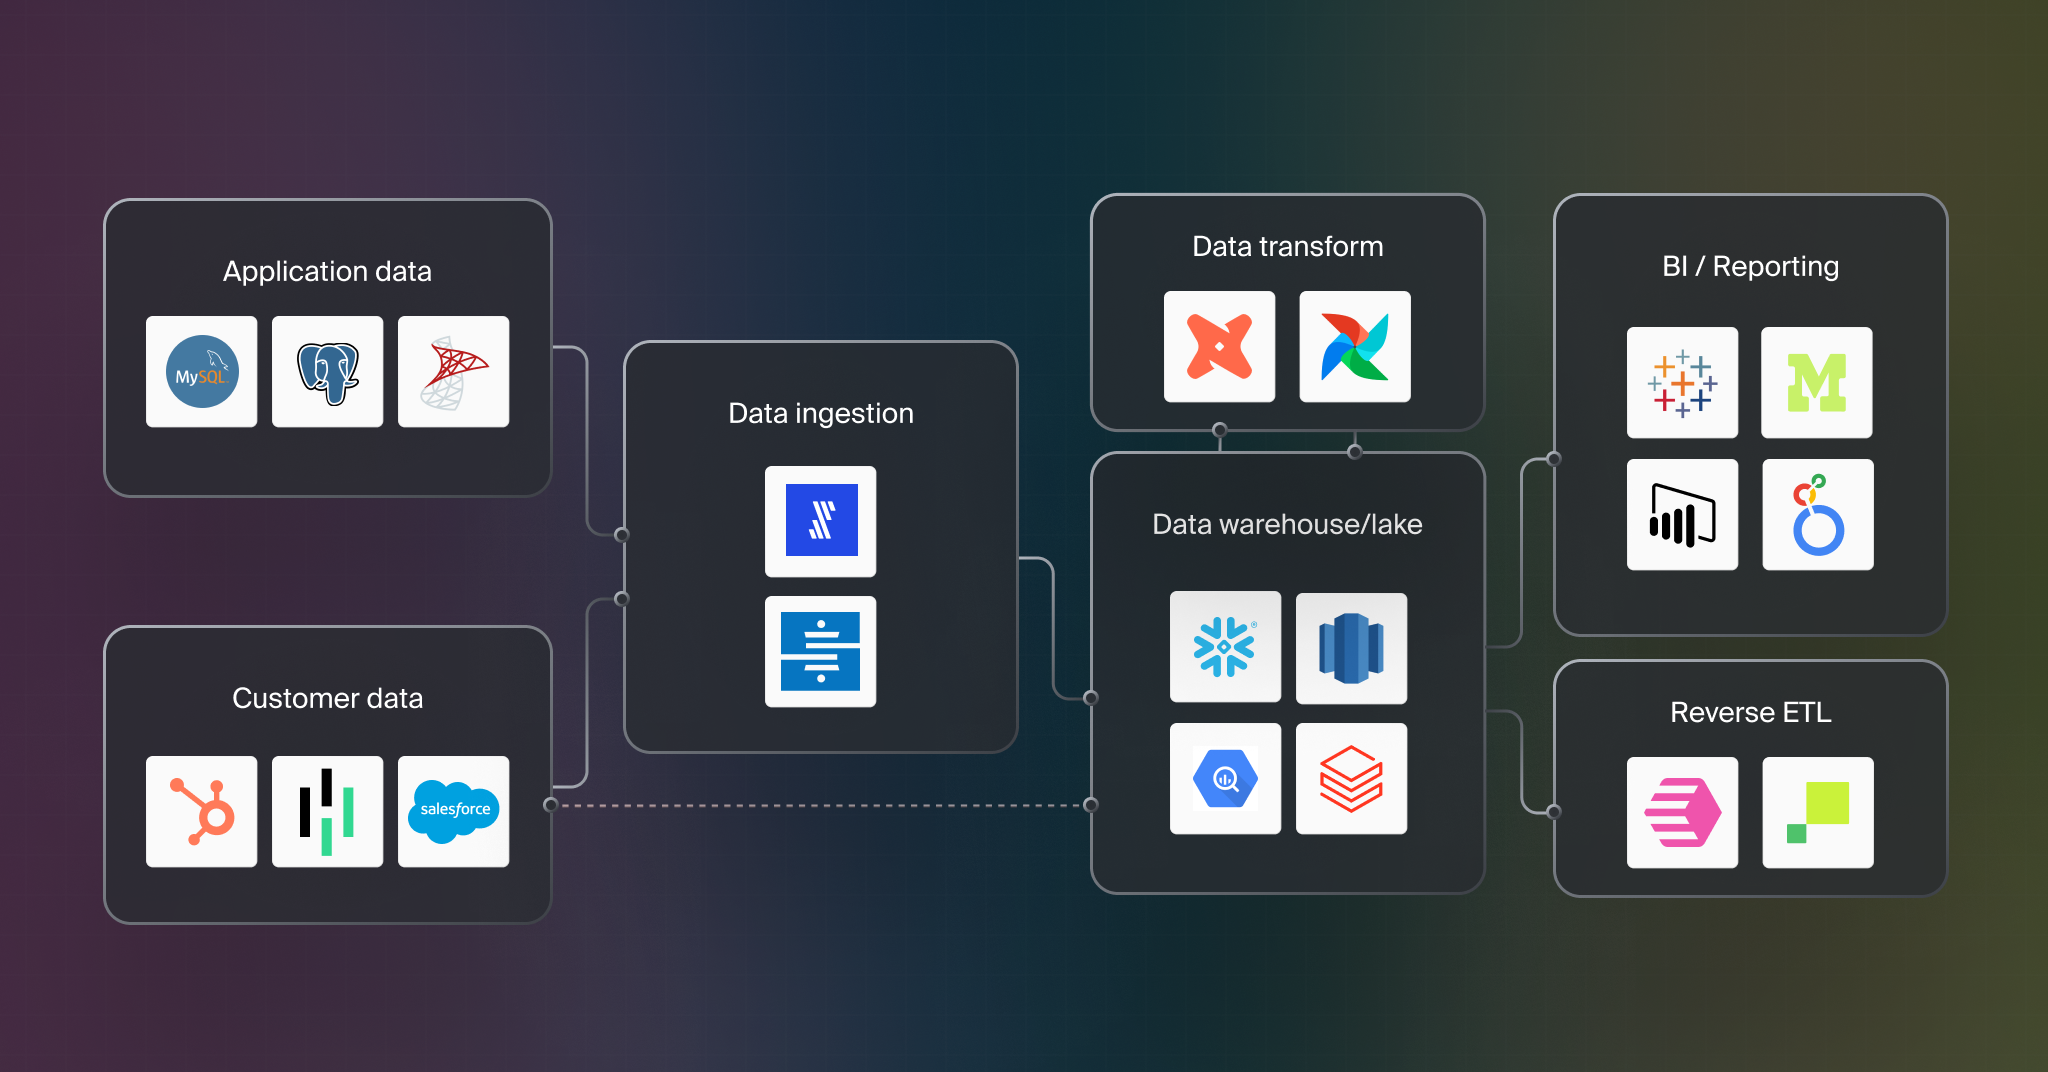
So what does their data stack look like? They primarily pull customer data and app data from an operational database into their data warehouse/data lake. They watch replication from integration tools (e.g. stitch or fivetran) and make sure that dbt jobs that transform data into the company’s data model are running correctly.
The modeled data is then connected to BI tools to generate reports or embed analytics into their app, or fed back to source systems using a reverse ETL tool.
For data observability, they use Bigeye.
At this point Becky and Frank have set up Bigeye monitoring on tables in their data warehouse/data lake. Production tables get deep metric coverage (grouped metrics, data quality metrics, distribution metrics) recommended by Bigeye’s Autometrics while the rest of their tables are lightly covered with pipeline reliability autometrics (freshness metrics, volume metrics, and schema change tracking). Bigeye collections are used to group important metrics together and they have connected Bigeye to Slack and Pagerduty for alerts.
Scenario 1: Triage in Slack results in a closed issue
Frank is on-call and gets pinged via Slack and via pager duty that his pipeline has some problems.
Frank can see that the value is slightly outside of threshold (2.22k vs 2.21k). This is actually a good thing since he expects the metric to grow. He could complete the triage of this issue by selecting monitor with adapt feedback to tell Bigeye this an expected value and to close the issue when thresholds have adapted and it’s had a healthy metric run.
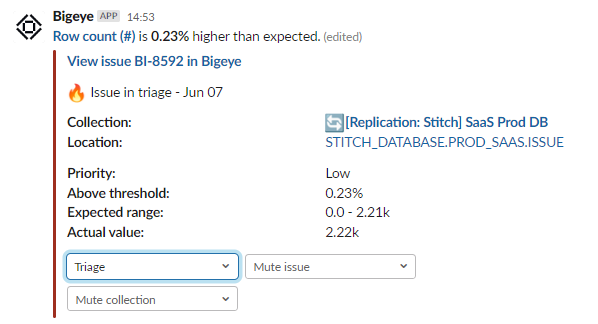
But maybe Frank decides to double-check by opening up the slack thread. He sees that Bigeye has sent a message to the thread saying that the metric actually has already returned to health!
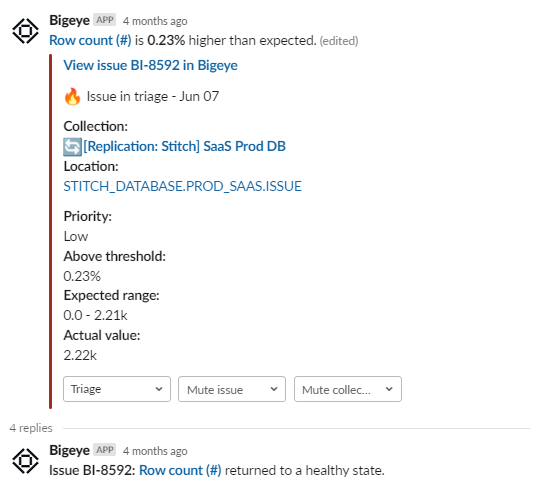
Instead of using a monitoring state, Frank can change the issue to the closed state. When Bigeye asks for feedback on the thresholds, he can choose to give it either adapt feedback (learn the changes) or maintain feedback (since the value may have returned to normal).
If Frank wanted to be even more confident in his decision, he could click into the app to look at the recent metric values. Looking at the chart, he can see there was a jump right at the edge of the threshold values. As mentioned before, this is a metric he hopes will go up. Since this is considered a new normal, he reaches the same conclusion: close the issue with adapt feedback.

After these actions, Frank has effectively resolved the issue and doesn't have any more follow up. Victory!
Scenario 2: Triage in Slack results in an Ack’ed issue
Frank looks at another alert in Slack and it says delivery of data to a table is late. This notification is troubling because the daily leadership report needs to be delivered by a certain time each day and this warning puts that in jeopardy.
Unfortunately, when he looks at the slack thread, there is no message about the metric being healthy and he doesn’t have enough information to quickly resolve the issue. Instead, in this case he decides to punt for now and follow up on this issue. Thus, in Slack, he changes the issue to the ack’ed state. This signals to his colleagues that the issue has been seen and he is working on it. This status update shows up in the app and in Slack.
Maybe Frank has a hunch about the problem – maybe it’s just slightly late and something that a little more detail could help resolve. Frank navigates from slack to Bigeye directly to the issue to get to more details. He can now see a chart and schema change details which provide insight into why the issue was created.
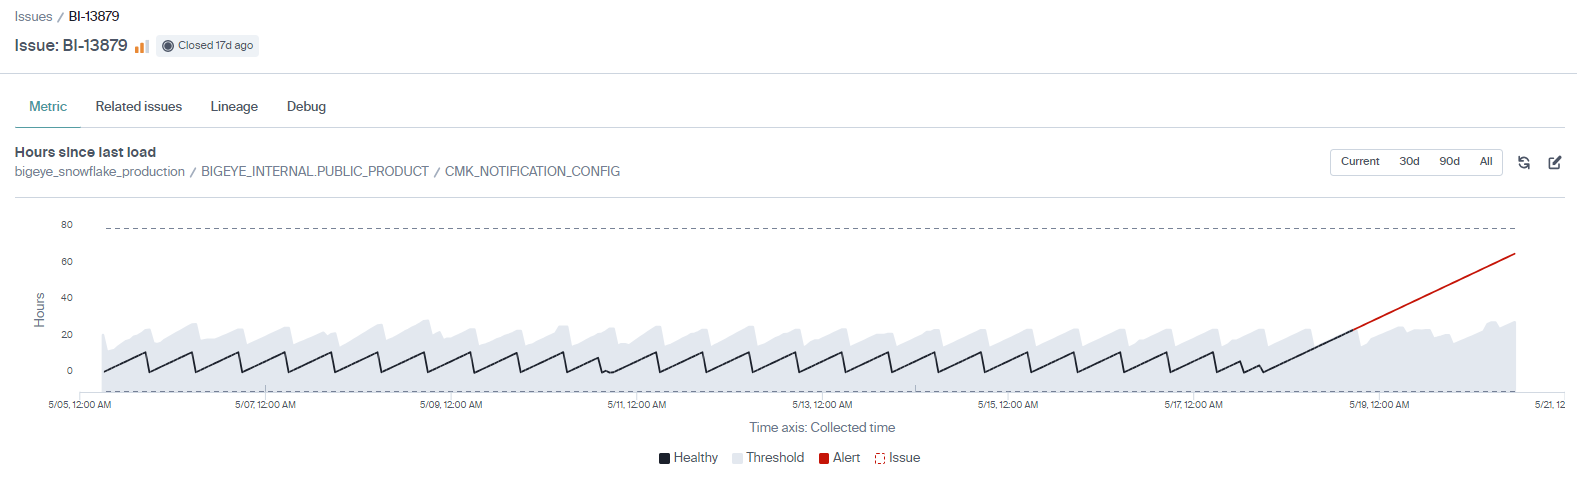
By reviewing the “Hours since last load” chart, Frank confirms that the regular loading pattern has changed. The last schema change was months ago and can be ruled out. So, at the moment there is no obvious root cause. Frank has other new issues to triage so he decides to punt this one for now and come back later.
Frank moves the issue to the ack’ed state. He knows it’s been flagged for further investigation after the triage pass. Bigeye automatically updates the issue and the slack notifications about the issue status to keep everyone in the loop.
We've covered two scenarios for triaging individual issues, but what about when you want to manage groups of issues in bulk? Stay tuned for part 2 of this series where we'll discuss scenarios for triaging issues at scale.
Monitoring
Schema change detection
Lineage monitoring

Jon Hsieh


.png)