.webp)
Get the Best of Data Leadership
Stay Informed
Get Data Insights Delivered
Sarah Krasnik leads data engineering at Perpay and is an active tech blogger. You can find her on Twitter or LinkedIn.
What is Reverse ETL?
Reverse ETL syncs data from a system of records like a warehouse to a system of actions like CRM, MAP, and other SaaS apps to operationalize data.
If you’re familiar with “traditional” ETL, this definition probably isn’t too surprising (many folks early on thought of reverse ETL as reverse Fivetran).
But if you’re not as familiar, let’s break it down. ETL stands for extract, transform, load. It’s the process of taking data from third-party systems and loading it into a data warehouse. Operations tools like reverse ETL do the exact opposite, moving cleaned and transformed data from a data warehouse to a third-party tool. The pioneers of the category, Census, have written about the topic at length if you’d like to take a deeper dive here.
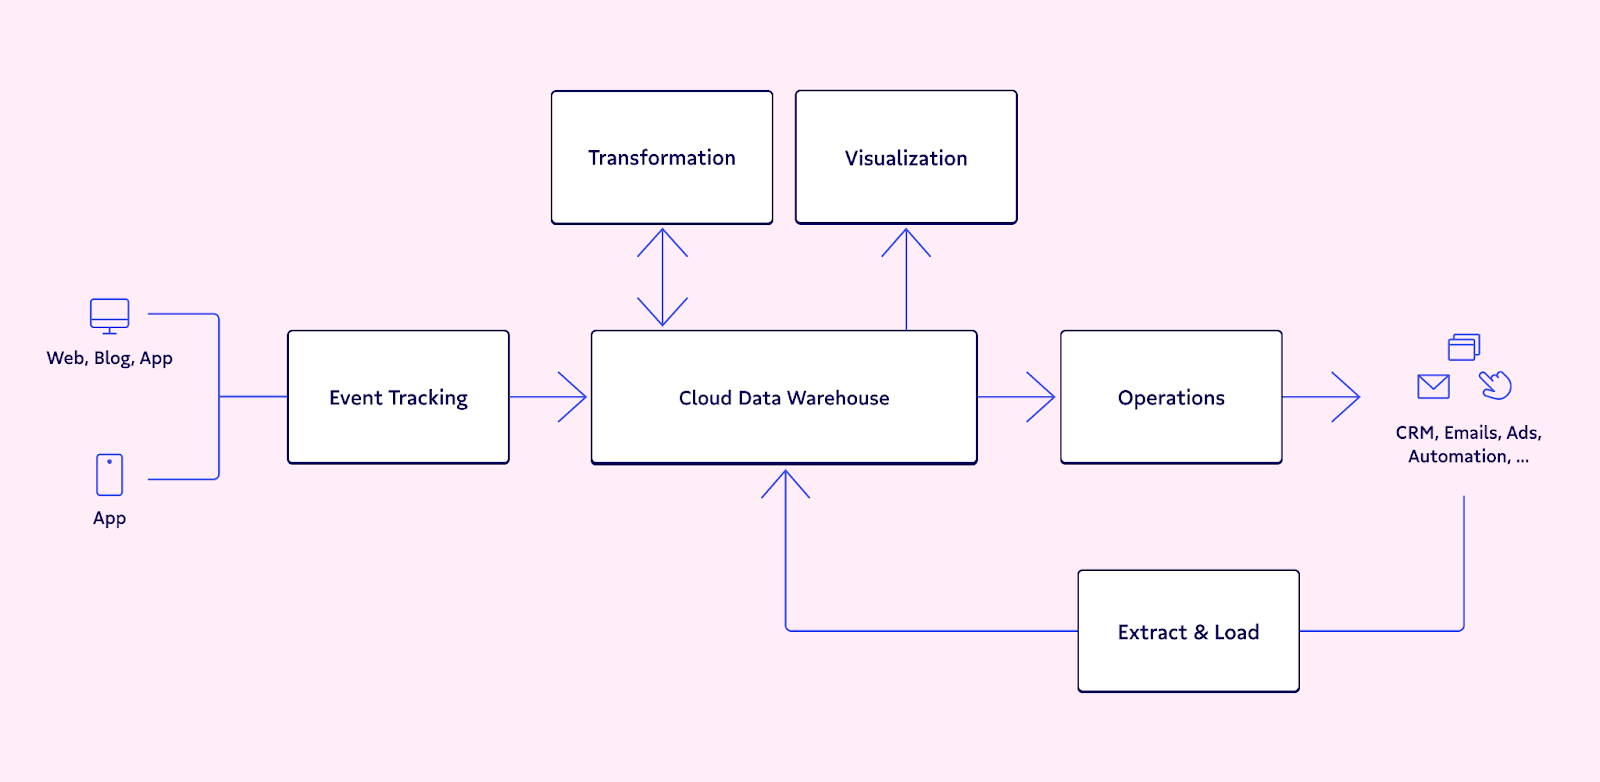
Credit: Census
Now you might be wondering: If you spent all that effort getting data into a data warehouse, why would you then take it back out of the warehouse? The warehouse isn’t where business teams spend the majority of their time—this data needs to be operationalized.
Reverse ETL as a means to operational analytics
Business teams interact most with operational tools. For ecommerce teams that might be Shopify, Salesforce for sales teams, Mailchimp for marketing teams. While data teams live and breathe in the data warehouse and data visualization tools, that’s not the case for most business teams. Nor should it be.
Data should be accessible to business teams natively in the tools they use most.
Truly data-driven organizations use data to drive day-to-day operations and action (vs. just letting data live and die in ad hoc reports and dashboards). While traditional analytics without reverse ETL focused on helping business teams drive decisions with data, operational analytics via reverse ETL enables those same teams to spend less time deliberating and more time taking real-time action with data. Afterall, what more productive way to do so than in automatic workflows within operational SaaS tools already embedded in the business?
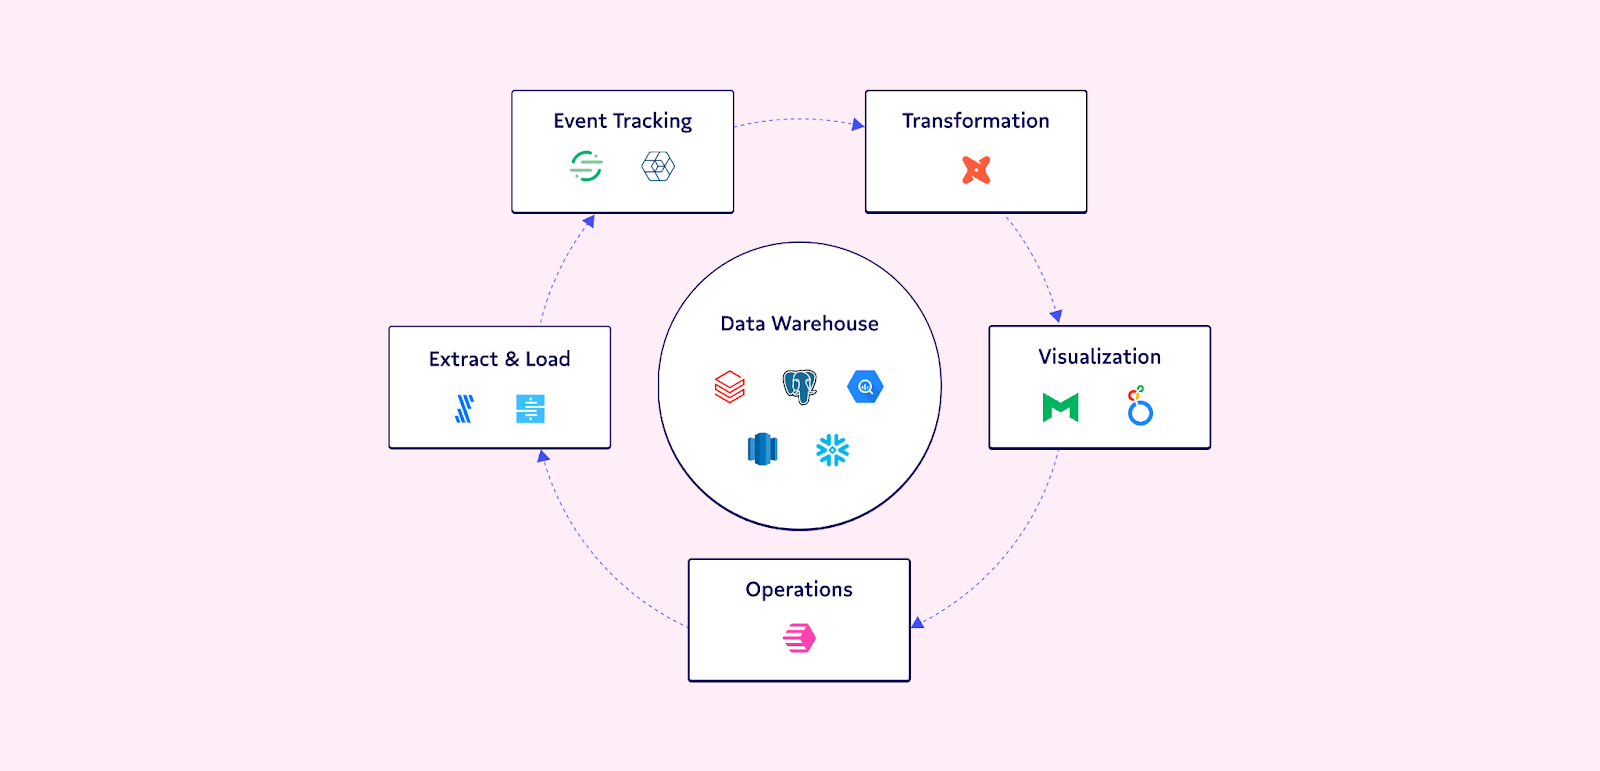
In the image above (credit: Census), you can see reverse ETL in the operations layer completing the continuous flow of data between data users (RevOps) and the data team delivering insights, all centered around the warehouse as the source of truth.
While reverse ETL makes sending data out of the analytics ecosystem much easier, it also highlights the need for trust in data accuracy and freshness. Data at the fingertips of business teams enables them to set up automatic workflows driving customer engagement, conversion, and generally improving the customer experience. Potentially inaccurate or incomplete data risks worsening all of the above.
As moving data has gotten easier, data quality is top of mind. Let’s zoom out to understand where data quality fits into the data stack.
How reverse ETL amplifies the need for data quality at scale
Data quality and observability can be defined in so many ways and are often misunderstood. At Bigeye, defining data quality involves defining what it means for the data to be “wrong” and what the threshold for good enough is.
To be more concrete, consider a column that defines which marketing table a user came from. If the user didn’t come from paid marketing, the column could be empty. Is this expected, or should the column then contain “Organic”? Getting alignment in this scenario means having all stakeholders understand when the column should and should not be empty.
Not having this type of alignment risks a worse user experience for the end customer. Following the flow of data without any checks in place, the empty values in the column are operationalized by reverse ETL and find their way into your marketing tool. Your awesome marketing team proactively set up automated workflows to the “Organic” population of users to further engage them. However, they come to you because no emails are being sent.
Not engaging customers to the highest potential due to misalignment is not a good position to be in.
Data quality and observability must happen before data is actually operationalized—a potential bug or missing data shouldn’t be surfaced to business teams, rather caught by data teams. That’s where Bigeye comes in, solving the problem of promptly alerting all stakeholders when data quality is at risk.
Confidence and trust in data must preface reverse ETL jobs running, so tools like Bigeye precede operationalizing analytics. However, startups grow quickly which means what data should look like also changes quickly.
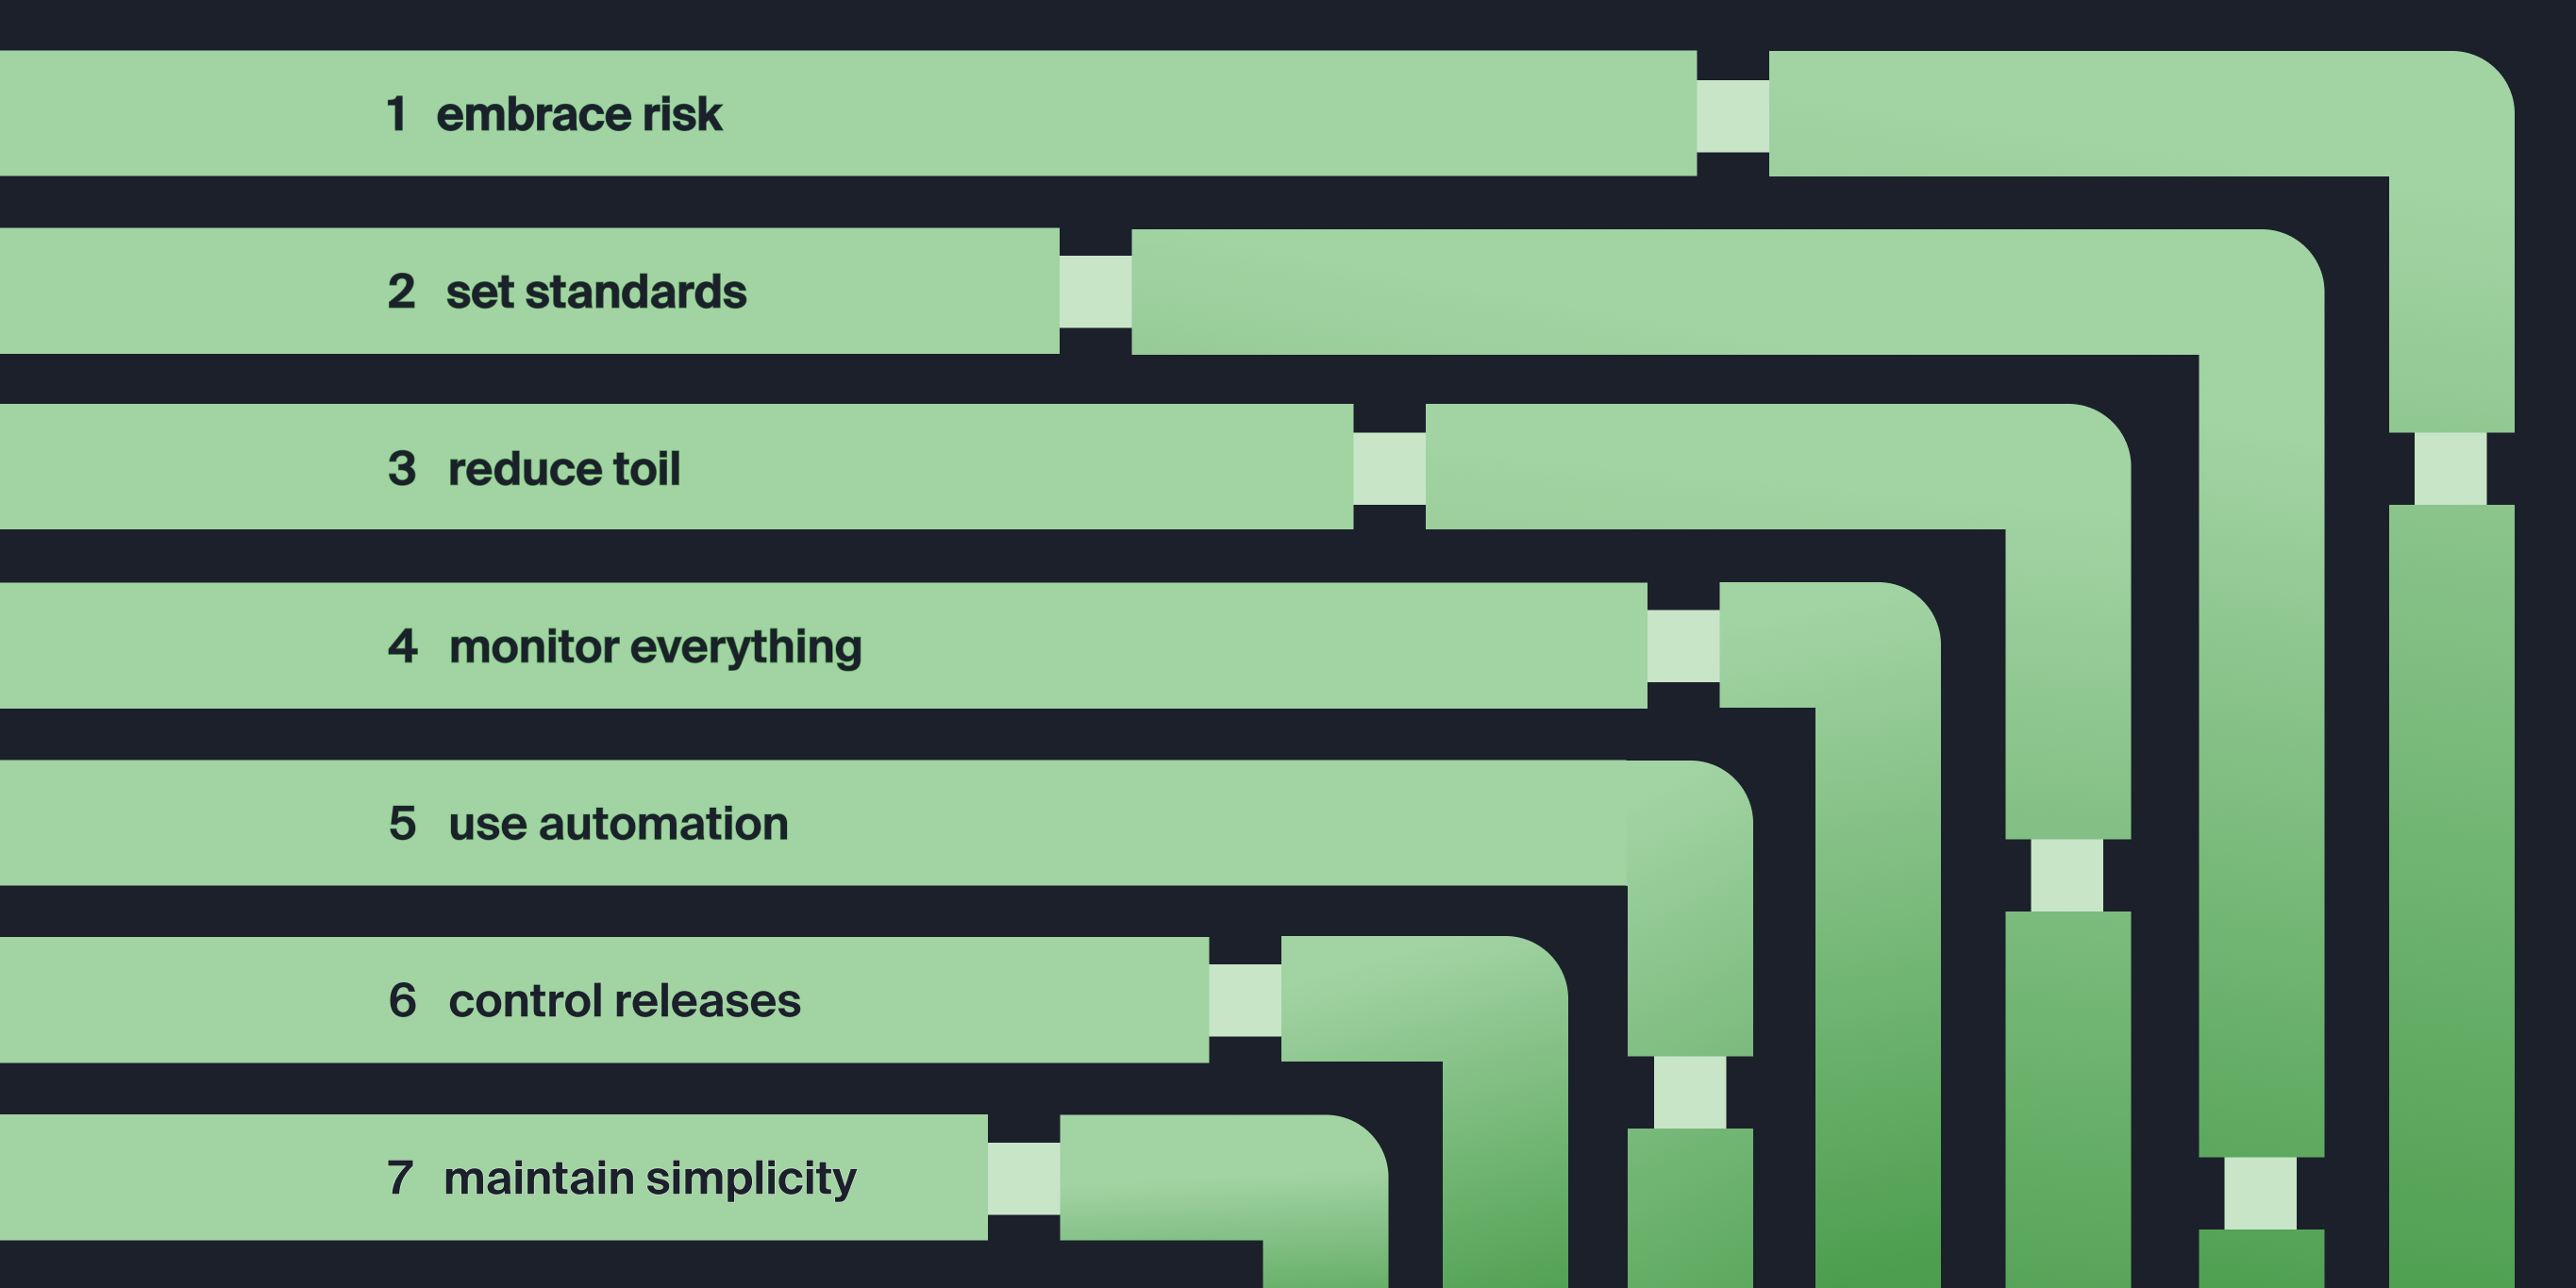
Algorithmically generated suggestions continue to protect against anomalies arising in your data, whether it be anomalies in missing data or in data distribution. The only way to keep data quality at scale is to reduce the human work needed to operate a system. Kyle Kirwan (CEO and co-founder of Bigeye) has written about the need for automation in data quality by outlining the principles of reliable pipelines.
Bigeye automatically detects what data quality metrics matter for the data, whether that’s freshness, nulls, duplicates, or any number of 60+ potential issues. Dynamic thresholds are set automatically within the tool to adapt to the business and alert the data team when something has gone wrong. In this way, Bigeye keeps up with the fast pace of data changes, building trust by not sending bad data to your operational tools.
Where to get started
Get started on your data quality and monitoring journey with Bigeye by requesting a demo here. Then, once you’re set up with Bigeye, get started operationalizing your data with Census to unlock automated data decisions.
Have any other questions about data quality or operational analytics? I’m happy to chat on Twitter.
Monitoring
Schema change detection
Lineage monitoring

Sarah Krasnik


.png)